|
Posted 11/20/24
CITIZEN MISBEHAVIOR BREEDS VOTER DISCONTENT
Progressive agendas face rebuke in even the “Bluest” of places

For Police Issues by Julius (Jay) Wachtel. This image from Google maps depicts a modest home in a working-class area of Los Angeles. We’ll have more to say about it later. But let’s begin with a major California city that’s even “Bluer” than L.A. We mean, of course, San Francisco. That’s where ardently progressive Mayor London Breed just lost her bid to continue serving the City by the Bay. While the victor, Daniel Lurie (a heir to the Levi Strauss fortune) is also “Blue”, he prides himself as being a moderate sort. In fact, his avowed goals of “restoring safety, ending homelessness and shutting down open-air drug markets” actually led the “Reds” to anoint him as their number-one pick.
Across the Bay the story was much the same. Voters in “Blue” Oakland recalled Mayor Sheng Thao and Alameda County Dist. Atty. Pamela Price, two strong liberal voices who had only been in office since 2022. According to a spokesperson for the Mayoral recall, Oakland’s progressives “did the same thing they did in San Francisco. They ignored the crime. They ignored the poverty.”
Click here for the complete collection of crime & punishment essays
Ditto, L.A. That’s where voters just handed D.A. George Gascon an overwhelming thumbs-down. A nationally-known progressive, his liberal policies, which forbid charging juveniles as adults, barred the prosecution of a wide range of misdemeanors, and disallowed the use of sentence enhancements, made more than a few assistant D.A.’s livid. In his place the electorate installed Nathan Hochman. A former Federal prosecutor and (surprise!) defense lawyer, his campaign pledge to cast aside Gascon’s permissive agenda drew fervent support from police and, as one might expect, from the D.A.’s disgruntled subordinates. And ultimately from the public, who handed the self-avowed crime fighter a twenty-percentage point margin.
And that’s not all. By an even greater margin of 40 percent California voters hollowed out a decade-old progressive measure, Proposition 47, that had watered down punishments for theft and drug crimes. Spanking-new Proposition 36 addressed the alleged consequences – a plague of smash-and-grabs that continues to beset retailers – by increasing penalties for group thefts and designating all thefts committed by repeaters as felonies. To combat the fentanyl and hard-drugs scourge that plagues the Golden State, punishments for drug dealing were also substantially stiffened.
Still, even if true, Mr. Hochman’s reassurance that cops’ hands won’t be “tied” during his shift at best offers an incomplete solution. According to newly-appointed LAPD Chief Jim McDonnell, the failure to prosecute “low-level” offending (read: bad-old George Gascon) made victims less likely to call police. Their reluctance to report crimes, he fears, has become so deeply entrenched that it’s actually exaggerated the magnitude of the so-called “crime drop.”
Chief McDonnell wants citizens to call the cops even for relatively minor crimes. Problem is, the reluctance to prosecute may have made cops reluctant to act. In any event, what ultimately happens has never been controlled by the first two wheels of the criminal justice system. Courts with judges and a correctional system with probation and parole agents occupy the really definitive end. Even if cops and assistant D.A.’s do their very best, the consequences of criminal misconduct are for others to decide. As we’ve frequently pointed out, those “consequences” often seem insufficient, sometimes wildly so. Check out our November 8, 2024 update to “A Broken System”:
Darion C. McMillian, 23, was recently released from parole after being imprisoned for a 2019 shooting. And on November 4 he was on electronic monitoring for a pending drug case when Chicago police officers approached the double-parked car that he occupied. McMillian opened fire with a pistol converted by a “switch” to full-auto, killing Officer Enrique Martinez and, apparently by accident, the driver of his own vehicle. McMillian fled but was soon arrested. Officer Martinez, himself a young person, had less than three years on the job.
 Soon after completing his parole term for the 2019 shooting, a crime for which he served four years in prison, McMillian picked up two arrests for felony drug offenses. Both times he was released with an ankle monitor to await further proceedings. He would soon use a homemade machinegun to murder Chicago police officer Enrique Martinez. A felon’s compassionate treatment was arguably responsible for a young officer’s violent death. And there’s been political consequences. Chicago Mayor Brandon Johnson, a progressive figure who’s considered no friend of the police, caught a lot of flack. Here’s what Hizzoner announced a few days before the fallen officer’s funeral: Soon after completing his parole term for the 2019 shooting, a crime for which he served four years in prison, McMillian picked up two arrests for felony drug offenses. Both times he was released with an ankle monitor to await further proceedings. He would soon use a homemade machinegun to murder Chicago police officer Enrique Martinez. A felon’s compassionate treatment was arguably responsible for a young officer’s violent death. And there’s been political consequences. Chicago Mayor Brandon Johnson, a progressive figure who’s considered no friend of the police, caught a lot of flack. Here’s what Hizzoner announced a few days before the fallen officer’s funeral:
I heard from the family and am honoring their request and will no longer plan to attend the honors funeral services.
Back to L.A. And to our image of that house. On November 7, 2024 its 93-year old resident told LAPD officers that she was hearing “knocking sounds” from underneath. Officers discovered that a 27-year old man had taken up residence in the crawl space. After “an hours-long standoff,” the naked trespasser

emerged. His L.A. Superior Court record is summarized above. As one might expect, his most recent tangle wasn’t his first. Also note that his record includes a felony conviction for crimes including “elder abuse,” which led to a prison term. His most recent offending – that crawl space thingy – is “only” a misdemeanor. So he was released, with a court date in December.
Care to wager on his behavior until then?
As we’ve repeatedly pointed out (see, for example, “Catch and Release,”) even chronic evildoers get breaks. Here, for instance, is our November 4, 2024 update to “A Broken System”:
Nineteen-year old Nhazel Warren had recent arrests for gun possession and fleeing when officers caught him illegally packing a pistol in July. He was released with an ankle monitor. Warren then committed a home invasion. He was arrested and released on bond and, again, with an ankle monitor. He went on to commit several more armed robberies; his most recent arrest was a week ago. Again, he was released on bond. And again, with a monitor. All along, Warren was supposedly being monitored by the Probation Dept. But there’s no record that they ever put his “tracking” devices to work.
Warren’s most recent release, which followed his reportedly fifth armed robbery arrest, was on $150,000 bail. Again, care to wager on how he’ll behave?
Be sure to check out our homepage and sign up for our newsletter
Misbehavior by releasees is commonplace. There’s a reason why one of our related posts (see below) was entitled “Cause and Effect.” Whether cops and prosecutors will vigorously address “lower level” offenses – and whether repeaters will be strictly dealt with by judges and agencies of supervision – is yet to be seen. Hopefully the measures promised by L.A.’s new D.A. and police chief will take hold, and there will be no need for us to wag “naughty, naughty” again.
Check back!
UPDATES (scroll)
5/27/25 As the clock struck midnight and the Memorial Day weekend got underway, crowds of rowdy revelers descended on L.A.’s downtown. Commuter trains were swarmed, and their interiors and exteriors were spray-painted with graffiti. Like treatment was accorded to several storefronts and to an (unoccupied) police car, which became a backdrop for selfies. And while squads of officers came on scene, and a police helicopter hovered overhead, no confrontations were reported. Neither were there any known arrests.
1/15/25 A national survey reports that 8 in 10 voters are seriously concerned about crime. Their attitudes are reflected in a toughening of criminal penalties, and particularly on drug and property offending. Mob thievery led to a proposal by a “Blue” Maryland state senator to enable filing felony charges against all participants in a group theft where the total take exceeds $1,500. According to Adam Gelb of the Council on Criminal Justice, there’s a sense that reforms have “overshot the mark and there needs to be a rebalancing.”
1/3/25 In 2012 San Diego, Calif. resident Mary Shojai declined Paul Carl Tomasini’s marriage proposal. So he violently assaulted her, repeatedly striking the 66-year old woman with a mallet until she was dead. Tomasini, who seemed deeply remorseful, was convicted of murder and drew life. But in 2022 California AB 960 provided for compassionate release. That law was recently applied to Tomasini, who developed terminal cancer while imprisoned. He’s been released to a “healthcare facility.” And Shojai’s daughter is incensed. His release, she says, has driven her family into “a state of hellish angst.”
12/5/24 Elected on a promise to cast aside his predecessor’s permissive agenda, Los Angeles D.A. Nathan Hochman got promptly to work. At his swearing in (by former Calif. Guv Arnold Schwarzenegger, no less) he announced a reversal of policies that had been reviled by progressive D.A. George Gascon’s own staff. Assistant D.A.’s will now be allowed to seek the death penalty and to prosecute low-level misdemeanors and drug crimes. Hochman reinstituted the use of sentence enhancements for gang and gun crimes, and prosecutors will once again be allowed to accompany crime victims to parole hearings.
11/21/24 An analysis by the Council on Criminal Justice reveals that shoplifting rates in Chicago, Los Angeles, and New York continue to be higher than pre-2020. Chicago’s rates, in particular, experienced a sharp uptick in 2024. Half-year 2024 shoplifting rates in a 23-city sample were also higher than for a comparable period in 2023.
|
Did you enjoy this post? Be sure to explore the homepage and topical index!
Home Top Permalink Print/Save Feedback
RELATED POSTS
Special topic: Bail & Sentence Reform
Post-Pandemic Blues A Broken System Cause and Effect
More Criminals (On the Street,) Less Crime? Reform and Blowback Catch and Release
Posted 10/12/24
WANT BROTHERLY LOVE? DON’T BE POOR!
Violence is down in Philly, L.A. and D.C. Have their poor noticed?
For Police Issues by Julius (Jay) Wachtel. Crime is reportedly down across the U.S. Comparisons between 2022-2023 reveal improvements in many violence-beset cities. Say, Philadelphia, where homicides plunged from 514 to 410. Less crime-struck places also got better. Murders fell from 438 to 386 in New York City and from 391 to 329 in Los Angeles.
Yes, crime and violence have fluctuated over time. Spikes in violence brought on by the pandemic continue to affect large metropolitan areas. While Philadelphia residents seem much better off today than in 2021, when they endured 562 homicides, The City of Brotherly Love had “only” 280 killings in 2015. Still, 104 fewer residents lost their lives last year. That’s inherently meaningful. And the seemingly favorable trend continues. According to the City Controller, in 2024 Philadelphia experienced 193 fatal shootings thru October 2. That’s a stunning 42 percent fewer than on that day in 2023.

Problem is, the benefits aren’t equally distributed. In 2023 Philadelphia suffered 1,666 “criminal shootings” (375 fatal; 1,291 nonfatal; fatal.) across its 45 ZIP Codes. The five most prosperous ZIP’s (left table, bottom row), average poverty 7.8 percent, suffered a cumulative 30 shootings, producing a rate of 19.2 per/100,000 residents. In contrast, the five neediest ZIP’s (right table, bottom row), average poverty 39.3 percent, endured a stunning 521 shootings. Philadelphia’s most economically-deprived residents were burdened with a per/100,000 pop. shooting rate of 246.3, nearly thirteen times worse than what their counterparts experienced.
Click here for the complete collection of crime & punishment essays
And what about 2024? According to the Controller, the city suffered 838 shootings thru Sept. 30, 2024 (174 were fatal; 664 were nonfatal.) That’s about half the total number of shootings in 2023, so the trend seems favorable. Alas, benefits remained unequally distributed. Through Sept. 30, the five most prosperous ZIP’s had 8 shootings, producing a nine-month rate of 5.1 per/100,000. Their five counterparts suffered a grisly 240 shootings, yielding a nine-month rate of 113.5. That’s more than twenty-two times worse.
Who really profits from “the great crime drop”? After all, income-based disparities are by no means unique to Philadelphia. Los Angeles is served by twenty-one geographical police Divisions. They suffered a total of 329 homicides in 2023. Murder rates for each Division were computed using LAPD’s 2023 homicide report, its Division population counts and Census poverty data.

Comparing the five LAPD Divisions at each end of the prosperity scale yields a contrast that’s shades of Philly. In 2023 LAPD’s five most prosperous Divisions, Pacific, Foothill, West L.A., West Valley and Devonshire (left table, bottom row), avg. poverty 9.8 percent, suffered an aggregate 38 homicides. That produced a murder rate of 3.5 per/100,000 residents. In sharp contrast, the five Divisions at the other end of the wealth scale, Rampart, Southeast, Southwest, Central and Newton (right table, bottom row), avg. poverty 26.6 percent, suffered 125 murders. That yields a homicide rate of 17 per/100,000, nearly five times worse. Like Philly, these hazards to life and limb continued into 2024. Although the number of homicides has trended down, the difference in the burden between affluent and poor increased to six-times-plus (respective rates 1.9 and 12.2).
Ditto, the District of Columbia. In 2023 its eight Wards endured a nearly lock-step relationship between poverty and homicide. Its four most affluent Wards (left table, bottom row), average poverty 5.1 percent, suffered an aggregate murder rate of 14.8 per/100,000 residents. In contrast, the four Wards on the economically-downtrodden extreme (right table, bottom row), average poverty 14.1 percent, endured a stunning homicide rate of 65.2 per/100,000. That’s more than four times worse. And while homicide seems to be substantially down in 2024, the poorer Wards continue to struggle with a murder rate that’s four times higher (partial-year rates 9.4 v. 37.7).

In March, 2023 Philadelphia’s Lenfest Institute for Journalism published the results of a community poll about the issues facing the city. “Crime and public safety” topped the list of citizen concerns. Black persons and residents of the city’s less-prosperous areas were far more likely to complain about the effects of gun violence. Ditto, Los Angeles. After an outbreak of shootings in the chronically poor, violence-beset Watts area last year, the leader of an L.A. peace coalition told the Los Angeles Times that citywide drops in violence “don’t necessarily reflect our reality.” His views were echoed by a gang interventionist. “It’s time for our children to be able to play outside, be able to walk to and from school safely…This isn’t a color thing.”
What can be done? Post-George Floyd, tactics such as stop-and-frisk have fallen out of favor. While some beleaguered places (i.e., Philadelphia, L.A. and D.C.) have embarked on a cautious re-set, aggressively policing violence-stricken neighborhoods inevitably leads to tangles with citizens. Officers are human, and frequently clashing with non-compliant souls can cause them to form stereotypes and develop attitudes that potentially distort all encounters. Black and Hispanic persons, who disproportionately inhabit poorer areas, are inevitably affected.
Be sure to check out our homepage and sign up for our newsletter
Improving the safety of economically-fraught neighborhoods clearly calls for a lot more than policing. L.A.’s impacted Watts residents offered two fixes: jobs and the economy. A landmark study by the Urban Institute found that properly addressing “distressed urban neighborhoods” requires a concerted effort to provide educational opportunities, job training, housing, child care, and the physical and mental health supports that are crucial to well-being. So here’s an idea. It’s become commonplace to partner officers with mental health professionals. Why not get social workers to ride along, as well? Once an immediate problem is under control, a knowledgeable specialist can assess things and start the complex and demanding process of getting a family – and its misbehaving members – the assistance they need.
Improving the dynamics of urban areas requires that we look within. “Cities” are constructs. As we’ve repeatedly emphasized, it’s neighborhoods that really, really matter. So let’s start there!
UPDATES (scroll)
7/8/25 “Coward, want-to-be-thugs stuff.” That’s how Philadelphia Police Commissioner Kevin Bethel described the early-morning massacre in the Grays Ferry neighborhood that killed three males ages 19-24 and wounded nine others, one critically. Those wounded included three youths, ages 15-17. Forty persons were reportedly present, and multiple shooters are believed to have been involved. According to investigators, a device that enables a handgun to fire fully automatically (an “auto sear”) was used.
5/12/25 Just published in The Lancet, a nationally-representative sample of 8,009 adults reveals that “nearly two-thirds” of U.S. adults have personally experienced gun violence. Race, ethnicity and “neighborhood socioeconomic disadvantage” are closely linked to their exposure. Nearly forty percent of Black persons have a friend or family member who has been shot, versus 25 percent of Hispanic persons and 16 percent of Whites.
5/5/25 D.C. homicide is reportedly down. But more youths are being shot. That’s affected even the “gentrifying” 4th. Ward, which has suffered two homicides this year. Most recently, the killing of an 18-year old male who was hanging out on the street with friends when gunfire erupted from a passing car. A 15-year old boy was also wounded. Some residents want more cops; others are calling for “violence interrupters” to mediate disputes. “Police are just reactionary” says the chair of a neighborhood watch group. “I think we could be doing more to be preventative.”
4/15/25 South L.A.’s fetchingly entitled “Green Meadows” neighborhood suffered yet another violent weekend, with three shootings that killed two persons and wounded one. A 13-year old girl who was inside her home when a dispute broke out nearby was struck in the head by a gunshot and fatally wounded. And two early-morning vehicle-to-vehicle shootings left a woman dead and a man critically wounded. So far, no arrests have been announced.
4/14/25 Philadelphia murders are reportedly down. But shootings by youths have bucked a seemingly favorable trend. Between 2010-2024 223 juveniles were charged with murder. In 2010 the number was 26; by 2018 it was “only” three. But killings then rose, reaching a stunning 39 in 2022. That dropped to a still-considerable 26 in 2024, the same as in 2010. Charges in nonfatal shootings are way up; there were twice as many (49) last year as in 2010 (24). Among other things, authorities blame teens’ exposure to and glorification of violence, a lack of opportunities, and the ready availability of guns.
3/27/25 Philadelphia credits a combination of strategies for bringing down violence in its chronically plagued Kensington neighborhood. More cops are on the street. “Grassroots community groups” conduct violence prevention home visits and help probation officers monitor troubled youths. A “Neighborhood Wellness Court” offers outpatient and inpatient treatment for troubled drug abusers. And a major effort to “spruce things up” by cleaning up graffiti and removing junked cars and debris is underway.
10/14/24 And the carnage in D.C. continues. Last week our nation’s capital suffered five dead in five shootings over four days. Two persons were also wounded in the gunfire, which reportedly took place in five different neighborhoods. D.C. also had three homicides from a fire, and one by a stabbing. Nine murders in four days. And that’s how the story in the Washington Post ends.
|
Did you enjoy this post? Be sure to explore the homepage and topical index!
Home Top Permalink Print/Save Feedback
RELATED POSTS
Neighborhoods special topic
Post-Pandemic Blues America’s Violence-Beset Capital City Is Crime Really Down? It Depends
De-Prosecution? What’s That? Policing Can’t Fix What Really Ails Good News / Bad News
What Cops Face Human Renewal Repeat After Us: “City” is Meaningless Is Crime Up or Down?
Posted 6/20/24
IS CRIME REALLY DOWN? IT DEPENDS…
Even when citywide numbers improve, place really, really matters
For Police Issues by Julius (Jay) Wachtel. Finally, some good news. And from our Chief’s inner circle, no less! According to the deputy head of the spanking-new White House Office of Gun Violence Prevention, Baltimore’s drop in killings is “the greatest success story” in the land. Indeed, its 2023 murder count of 262 is the “Charm City’s” lowest toll since 1970. Baltimore’s most recent quarterly numbers are also supposedly very promising. (For more trumpeting about the city’s comeback check out “With Baltimore homicides dropping below 300, who gets to take credit?”).
We’ve often mentioned Baltimore’s struggle with crime and violence (see, for example, “Police Slowdowns, Part I.”) So the reported improvement was of great interest. Alas, the apparent turnaround came on the heels of some very bad news about our home burg. During his recent interview by the Los Angeles Times, LAPD interim Chief Dominic Choi observed that while his city’s violent crime numbers are about the same as last year, murders did increase about eleven percent when compared to the first half of 2023.
Click here for the complete collection of crime & punishment essays
Chief Choi’s comments definitely got our attention. After all, if that spurt in killings continues, it could thrash L.A.’s reputation. But before bringing out the tinsel (for Baltimore) and the hankies (for L.A.) let’s see how they compare with other major burg’s. Say, Chicago and New York City. Cranking up our calculator (well, an Excel spreadsheet) we assembled 2015-2023 homicide counts for Baltimore, L.A., New York City and Chicago. Data came from the UCR, the Baltimore Sun, Chicago P.D., the L.A. Almanac, and the City of New York. And since the cities differ in size, rates were computed using population figures from the Census. Here’s the product:
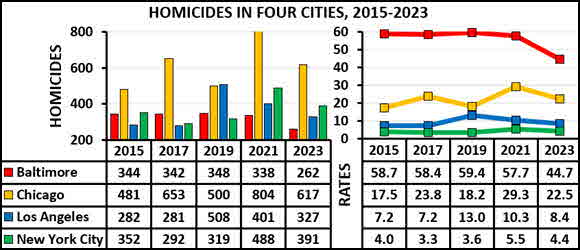
Each city has demonstrated substantial progress. Baltimore’s homicide numbers, for example, declined by 22.5 percent between 2021-2023. But disparities in population size can deceive. Switch to the graph on the right. Improvements notwithstanding, Baltimore wound up with a sky-high rate of 44.7 homicides per 100,000 residents. That’s twice that of bad-old Chicago. It’s also more than five times L.A.’s rate and ten times the Big Apple’s.
Yikes.
So is crime really on the mend? And if so, for whom? After a decade-and-a-half of poring through crime data, we’re convinced that (as our subtitle insists) place really, really matters. That, indeed, was the title of our 2020 post, “Place Matters”. To take in-depth looks within Baltimore and Los Angeles we compiled homicide counts for each city during the first four months of 2020, 2021, 2022, 2023 and 2024. Each city’s population was split into high-poverty (red) and a low-poverty (green) groups of approximately equal size, and four-month (i.e., partial year) homicide rates were computed for each.
- Baltimore crime data came from its city website. We coded each homicide location’s ZIP code and obtained its poverty rate from the Census. To correct for ZIP’s that cross city boundaries, their percentage of Baltimore’s population was obtained from US Zip Codes. Baltimore residents were assigned to two groups of approximately equal size: those living within ZIP’s with poverty rates between 5.4% and 19.1%, and those residing in ZIP’s with poverty rates between 21.5% and 40.8%.
- Los Angeles crime data was also pulled from the city website. Homicide locations were coded for a police Division, and rates were computed rates using LAPD Division population and poverty figures from our 2023 post, “Does Race Drive Policing?”. As in Baltimore, L.A. residents were split into two groups of about the same size: residents of LAPD Divisions with poverty rates between 7.2% and 13.6%, and residents of Divisions with poverty rates between 14% and 36.3%. Here are the products:
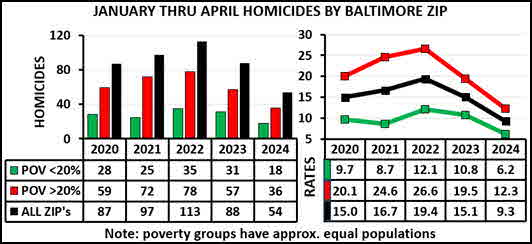
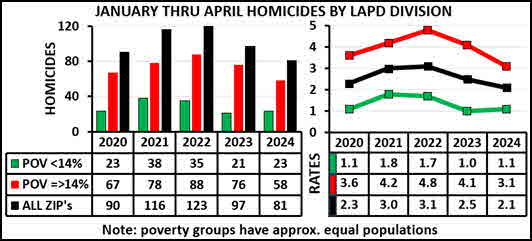
What’s the uptake? Despite a small, recent increase in homicide rates in L.A.’s lower-poverty zone, January thru April murder rates have improved for both cities since 2022. Still, poverty matters. A lot. Residents of Baltimore’s higher-poverty ZIP’s have consistently suffered from homicide rates that are at least twice as high as those endured by their more fortunate peers. Meanwhile, in comparatively tony Los Angeles, the proportionate disadvantage between affluent and not-so-affluent Divisions is about three-fold.
And as far as comparing Baltimore and Los Angeles…fuhgeddaboudit!
Residents of economically-deprived areas are well aware of their vulnerability. Say, the residents of Baltimore’s “Brooklyn Homes” neighborhood, where more than one in four live in poverty. That’s where on July 2, 2023 as many as ten shooters opened fire during a yearly celebration, killing two and wounding twenty-eight. According to the AP, the carnage – reportedly Baltimore’s worst-ever mass shooting – took place during the same week that the Feds bragged about reducing violence in the beset city. Their “success” was clearly lost on the war-weary sixty-six year old who bandaged the leg of a wounded teen. “They don’t even know what life is, they don’t,” she lamented. “All they know is guns.”
Her son and grandson were killed in prior shootings.
 Violence and hooliganism don’t just plague Baltimore. “The safety numbers that are reflected citywide don’t necessarily reflect our reality.” Last year, after a shooting that wounded nine and killed two, that’s how the executive director of L.A.’s Urban Peace Institute described the gap between the city’s favorable overall numbers and life in violence-beset Watts. Burdened with a poverty rate of 21.9%, residents of LAPD’s 77th Street area endure one of the five highest homicide rates out of 21 LAPD Divisions. Switch to another member of the murderous “bottom five”, the adjoining Southeast area (poverty 23.7%). Click on the image to check out what happened at a local auto parts store this June. Violence and hooliganism don’t just plague Baltimore. “The safety numbers that are reflected citywide don’t necessarily reflect our reality.” Last year, after a shooting that wounded nine and killed two, that’s how the executive director of L.A.’s Urban Peace Institute described the gap between the city’s favorable overall numbers and life in violence-beset Watts. Burdened with a poverty rate of 21.9%, residents of LAPD’s 77th Street area endure one of the five highest homicide rates out of 21 LAPD Divisions. Switch to another member of the murderous “bottom five”, the adjoining Southeast area (poverty 23.7%). Click on the image to check out what happened at a local auto parts store this June.
Of course, it’s not just poor areas. As we recently reported, violent crime has a way of intruding into assumedly “safe” places. Say, the upscale L.A. suburb of Tustin (poverty, 10.1%) where an off-duty member of the President’s Secret Service detail was accosted by an armed robber. (He’s still on the lam). Or, say, L.A.’s affluent Venice neighborhood (poverty 9.8%), which features miles of canals lined with “multimillion dollar homes.” That’s where a brutal attack on two middle-aged residents by a homeless man left the “shaken community” struggling with how to respond to the unhoused in their midst.
Be sure to check out our homepage and sign up for our newsletter
Crime and violence have a way of intruding just about anywhere. But the profound advantages that prosperous areas enjoy – not only in Baltimore and L.A., but everywhere – offers an obvious path for improvement. Here’s a closing shot from the closing shot in “Fix Those Neighborhoods!” (November, 2020):
…here’s a hint for Mr. Biden, who absent a coup, will assume the throne in January. Your predecessor talked up a good idea. Alas, it was just that: “talk.” America urgently needs to invest in its impoverished neighborhoods. A comprehensive “Marshall Plan” that would raise the educational and skill levels and improve the job prospects, lives and health of the inhabitants of these chronically distressed places seems the logical place to start.
If you come up with a better solution, be sure to let us know!
UPDATES (scroll)
7/21/25 Violence of all sorts continues to beset troubled areas of Chicago and Los Angeles. Four persons were killed and eleven were wounded during an overnight spate of shootings in Chicago's
West and South Side neighborhoods. Meanwhile in L.A.'s East Hollywood area, a patron who got booted from a nightclub's hip-hop/reggaeton event drove his car into a crowd waiting to enter,
leaving seven patrons in critical condition and injuring two dozen others. An unknown passer-by then shot Fernando Ramirez, 29, in the back.
7/10/25 LAPD
recorded 116 homicides between Jan 1-June 28, 2025. That compares with 152 during that period last year. Should this trend continue LAPD expects that its year-end
homicide totals will be the lowest since 1968. Murders are markedly down even in the city’s chronically troubled areas. Other major cities are experiencing
like trends. One expert attributes the improvements to the “strong investment in communities from private and public sources” that helped the nation
recover economically from the pandemic. An LAPD official credits a “beefed-up police presence” and a focus on the “small group of hardcore
offenders” who purportedly cause “most of the violence.”
7/8/25 Baltimore claims it’s turned a corner. During this year’s first half the violence-beset city has suffered 68 murders, a “nearly 23 percent decrease” from that period last year and the fewest in fifty years. What’s to credit? When Mayor Brandon Scott came to office in 2021 he announced a plan “to approach gun violence as a public health threat instead of simply a crime issue.” Ergo, “violence interrupters, community organizations and trauma-informed support systems in impacted neighborhoods.” Police have also adopted a more “targeted” approach with a focus on gun offenders and “group violence.” For Mayor Scott, it really is all about place.
7/7/25 Lethal gunplay struck several cities during the overnight hours of July 4th.-5th. In Indianapolis a street brawl devolved into a mass shooting. Two teens, ages 15 and 16 were killed, and five persons ages 17 to 21 were wounded. “Several guns” were recovered. About the same time, a “large altercation” in Brockton, MS also ended with gunfire. Six were wounded, apparently none fatally. And in chronically beset Chicago, a spate of violent episodes (click here and here) in its chronically troubled neighborhoods killed four and left at least eight wounded.
4/29/25 Located on the edge of Angeles National Forest about 15 miles NE of downtown L.A., the relatively prosperous suburb of Altadena was devastated by one of the area’s recent firestorms. Its scarred residents, of whom half lost their homes, must now contend with yet another threat: the thieves who course through each night. Thefts and burglaries are reportedly up 450%, and even occupied homes are being hit, some repeatedly. Residents complain that they’re not getting the same security as far tonier Pacific Palisades, which also burned, but where crime remains on an even keel.
2/3/25 A Friday evening, Jan. 31 shooting in chronically impoverished South Los Angeles left two men dead and wounded four men and a boy. Nine days earlier “a confrontation between rival gang members” in L.A.’s beset MacArthur Park area wounded six, three critically. In-between these episodes, the L.A. Times reported that LAPD’s number of cops - 8,620 - is the fewest in thirty years. But it reassured readers that “recent crime statistics indicate the city is becoming safer even as the department shrinks.
12/11/24 According to DOJ, violent crime is on a favorable track. Data from 85 cities indicates that it continues to decline in 2024, with year-thru-third quarter drops of 17.5% for murder, 7.1% for rape, 3.6% for aggravated assault, and 7.8% for robbery. Substantial improvements are being reported by authorities in Los Angeles and the District of Columbia. In the latter, credit is given, in part, to a stiffening of penalties, more aggressive prosecution, and a comprehensive gun-violence prevention program. Within-city differences, though, receive no mention.
11/27/24 “Operation Tornado Alley” combined the resources of local and state police and Federal agencies in a massive sweep directed against four violent criminal organizations that have beset Baltimore with shootings, robberies, and the sale of guns and drugs. Nearly forty persons were arrested as agents coordinated the execution of sixteen search warrants, seizing large amounts of drugs, $373,000 in drug proceeds, 15 stolen cars, and 65 firearms, including ghost guns and converted machineguns.
9/24/24 Just released, the FBI’s 2023 Uniform Crime Report, which assertedly covers 94.3% of the U.S. population, reports a three-percent decline in violent crime from the preceding year. Murder and non-negligent manslaughter are down 11.6%, aggravated assault declined 2.8%, and robbery fell by 0.3%. Click here to explore the data.
8/27/24 A suspect in two Chicago-area bank robberies was captured on camera. And the photo of the stick-up is something that one is unlikely to forget.
8/14/24 In violence-beset Baltimore, the police killing of an admittedly armed teen was bitterly criticized by residents who felt that his having a gun was insufficient reason to open fire. But police insist that 17-year old William Gardner pointed the gun at officers during a foot pursuit. Whether that’s true isn’t clear from officer bodycams. Police Commissioner Richard Worley, who called the incident “tragic”, said that officers had repeatedly told the youth to drop his pistol during the chase. But he didn’t.
|
Did you enjoy this post? Be sure to explore the homepage and topical index!
Home Top Permalink Print/Save Feedback
RELATED POSTS
Neighborhoods special topic
Post-Pandemic Blues Want Brotherly Love? Don’t Be Poor! Good News / Bad News
Policing Can’t Fix What Really Ails Does Race Drive Policing? Place Matters
Fix Those Neighborhoods! Repeat After Us: “City” is Meaningless Police Slowdowns, Part I
Is Crime Up or Down? It Depends...
Posted 4/27/24
DE-PROSECUTION? WHAT’S THAT?
Philadelphia’s D.A. eased up on lawbreakers. Did it increase crime?
For Police Issues by Julius (Jay) Wachtel. The slugfest between academics kicked off in July 2022. That’s when Criminology & Public Policy published Thomas P. Hogan’s “De-prosecution and death: A synthetic control analysis of the impact of de-prosecution on homicides”. Mr. Hogan, a lawyer, has served as a Federal prosecutor and D.A. He holds a Master’s in criminology and is a skilled statistician. His deeply-researched article, which focused on Philadelphia’s purposeful throttling back of felony and misdemeanor prosecutions between 2015-2019, compared its criminal homicide numbers and case characteristics with those of the other largest 100 U.S. cities, applying elaborate controls on everything from demographics to prosecutorial policies and resources. He concluded that Philadelphia D.A. Larry Krasner’s policy of de-prosecution, which he instituted in February 2018, only a month after taking office, had caused a “historically large increase in homicides” of about 74 more per year.
And yes, there was blowback. In an elaborate critique, “De-prosecution and death: A comment on the fatal flaws in Hogan (2022)”, researchers Jacob Kaplan, J.J. Naddeo and Tom Scott argued that methodological and data issues essentially nullified Mr. Hogan’s findings. In a prompt and mind-numbingly elaborate rejoinder, “De-Prosecution and A Cordial Reply to Kaplan, Naddeo and Scott,” Mr. Hogan countered that it was the critique that was fatally flawed. Among its other failings, it supposedly relied on severe undercounts of Philadelphia homicides. He insisted that once these (and many other) errors were corrected, the contrarians actually lent his conclusions even more weight. He also insisted that his findings were not surprising. After all, they're consistent with the classic model of deterrence, which is based on “swiftness and certainty of apprehensions, then leading to sanctions”
Click here for the complete collection of crime & punishment essays
Concerns about the effects of de-prosecution have drawn the attention of other academics. A new essay in Criminology & Public Policy, “Do progressive prosecutors increase crime? A quasi‐experimental analysis of crime rates in the 100 largest counties, 2000–2020”, concludes that progressive prosecutorial policies led to a statistically significant seven-percent jump in property (but not violent) crime rates.
Slugfest over “cause” aside, what’s not at issue is that the alleged “effect” – an increase in violence – did take place, and that Philadelphia’s steep rise has been more-or-less in sync with its progressive D.A.’s tenure. Elected in a community where “Blues” outnumber the “Reds” seven to one, Mr. Krasner took office in January 2018 vowing to tone down the harsh, punitive policies of his predecessors. He was re-elected in 2021, and his current, second term will end in 2026.
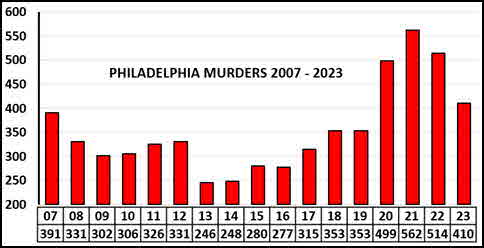
We used Philadelphia PD data to build this graph. After a steep retreat in 2013, when murders reached a low of 246, criminal homicides began to increase. In 2017 there were 315, and by the end of 2018 – Mr. Krasner’s first full year in office – they reached 353. After remaining at that level through 2019, murders really took off. In pandemic-addled 2020 they numbered 499, a single-year increase of 41 percent. And they kept going up, reaching a decade-and-a-half high of 562 in 2021. Things then toned down, and by 2023 killings were “only” sixteen percent higher than in 2019.
Full stop. The pandemic supposedly increased violence everywhere. Switching to murder rates per 100,000 population, let’s bring in two demographically similar, violence-prone places, D.C. and Chicago. Check out this graph (click here for Philadelphia stat’s, here for Chicago, and here for D.C.)
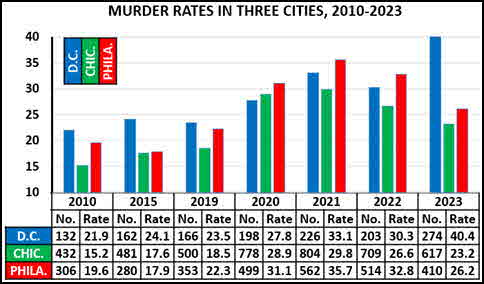
As one would expect, each city experienced a substantial uptick during 2019-2020. Chicago’s rates increased the most, by 10.4 points. Philadelphia came in second at 8.8 points, and D.C. was third with 4.3 points. Murders in Chicago and Philadelphia have since eased back. But as we recently mentioned in “America’s Violence-Beset Capital City”, D.C.’s criminal homicide count shot through the roof.
Note that killings in Chicago and Philadelphia track quite closely. Might that bring the “cause” behind Philly’s increase (de-prosecution) into question? Actually, Chicago’s experience lends support to Mr. Hogan’s thesis. You see, Kim Foxx, its elected D.A., has also come under severe fire for her progressivism. While the political blow-back has been most harsh from “Red” ideological sorts, former members of her own staff have roundly blamed her for the Windy City’s violence problem.
Philly, meet Chicago!
The reasons for Philadelphia’s sharp, post-2018 spike in violent crime was ultimately addressed by State legislators. Pennsylvania House Resolution 216, adopted during the 2021-2022 session, established a committee to “investigate, review and make findings and recommendations concerning rising rates of crime, law enforcement and the enforcement of crime victim rights.” Issued in October 2022, its “Second Interim Report” blamed D.A. Krasner’s progressive policies. Among many other things, he had prohibited assistant D.A.’s from charging crimes relating to marijuana or prostitution, strongly discouraged them from prosecuting lesser retail thefts, and severely limited requests to impose cash bail. More than a few prosecutors had objected. Thirty-one were promptly fired:
One of the 31 ADAs let go by DA Krasner in his first week in office told the Select Committee that DA Krasner’s mismanagement led to an office that is essentially full of defense attorneys who just want to get defendants out of jail.
It’s not just Philadelphia and Chicago. Many current and former deputies have criticized Los Angeles County D.A. George Gascon for a “soft on crime” approach that, among other things, limits the use of sentence enhancements and prohibits transferring juveniles to adult court. Several sued alleging that he retaliated against them for opposing his policies; one was just awarded $1.5 million. Although a recall campaign failed, Gascon faces eleven challengers in the forthcoming primary. His prospects are decidedly uncertain.
Posts in Police Issues’ “Neighborhoods” special topic frequently comment on the strong link between violence and poverty. Police precincts in economically downtrodden areas throughout the U.S. report substantially higher rates of murder, aggravated assault and robbery. For example, check out recent probes of D.C. (“America’s Violence-Beset Capital City”) and New York City and Los Angeles (“See No Evil, Hear No Evil, Speak No Evil”). Philadelphia is no exception. These graphs use Philadelphia’s official crime data to illustrate the relationship between poverty and criminal homicide during the first three months of 2013, 2018, 2023 and 2024 (each murder is a “dot”). Addresses were coded for their Zip’s, and Zip poverty figures were drawn from the Census.
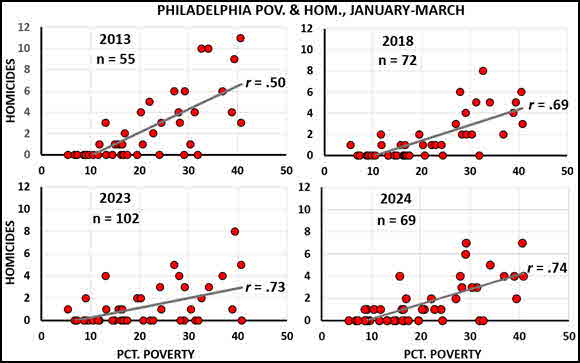
We computed the r (correlation) statistic between poverty and murder for each of the four three-month datasets. It ranges from zero, meaning no relationship between variables, to plus or minus 1, meaning a perfect association. In 2013 the relationship, r= .50, was of moderate strength. Generally, as poverty increased, so did homicide. By 2018 their link had become stronger, producing an r of .69. And the correlations in 2023 and 2024 (.73 and .74) were even more substantial. Bottom line: residents of Philadelphia’s poorer areas were disproportionately affected by murder from the start. And things only got worse.
According to Zipcodes.com, Philadelphia has 46 residential Zip’s. We broke them down into low- and high-poverty groups (less than or more than 20 percent poverty), then used population figures to compute homicide rates per 100,000 population for each:
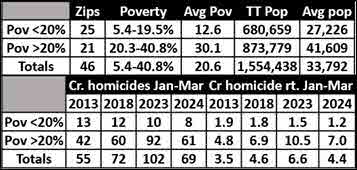
One caveat is that a few Zip’s extend beyond the city limits, so some murder counts may be slightly understated. That aside, there is a profound difference in murder rates between better-off Zip’s and their economically-struggling counterparts. In 2013 the average murder rate for all 46 Zip’s was 3.5. But the average rate for the poorer (4.8) was two-and-one-half times that of the wealthier (1.9). And it got worse. In 2023 the disparity (1.5/10.5) was seven-fold, and in 2024 it was nearly six-fold (1.2/7.0). That’s why the r’s got so pronounced.
Once again: residents of poorer areas got the short end of the stick from the very start. And things got worse over time. Much worse.
No, we’re not blaming it all on de-prosecution. According to NIJ, “the likelihood of being caught and punished” are crucial to deterrence. That automatically brings cops into the picture:
The police deter crime when they do things that strengthen a criminal’s perception of the certainty of being caught. Strategies that use the police as “sentinels,” such as hot spots policing, are particularly effective.
An article just published in Criminology & Public Policy, “Can increasing preventive patrol in large geographic areas reduce crime?”, concludes that “increased police presence and increased police patrols” (say, a so-called “hot spots” approach) led to statistically significant reductions in both property and violent crime. And when cops (perhaps driven by the likelihood that D.A.’s won’t prosecute) step back, the consequences can be dramatic. “When police pull back: Neighborhood-level effects of de-policing on violent and property crime” examined the effects in Denver. A post-Floyd decrease in traffic and pedestrian stops (there were 32,000 fewer in 2020) was significantly associated with an increase in violent crime. And the corresponding drop in drug arrests was tied to an increase in property crime.
Bottom line: “de-policing” is probably more likely than “de-prosecution” to encourage misbehavior. After declaring “a public safety emergency” in January, Philadelphia’s new Mayor, Cherelle Parker asked that officers return to using “stop and frisk,” a practice they had apparently discontinued after complaints it was being abused. The desire for a more active police presence is also percolating through violence-beset D.C. On March 11, Mayor Muriel Bowser signed “Secure D.C.” One of the massive bill’s provisions directs police to designate “drug-free zones” in areas troubled by crime and disorder. Another stipulates that violent crimes, whether committed by adults or juveniles, carry a “rebuttable presumption in favor of pretrial detention”. And a brand-new law invokes heavy penalties for directing organized retail theft.
Be sure to check out our homepage and sign up for our newsletter
A desire for more policing has even made itself felt in…San Francisco! Faced with a steep rise in drug use and homelessness, the most progressive major burg in progressive California recently loosened its reins on the cops. By a 60-40 majority, voters set aside a bucketful of rules that severely restricted what officers do and how they go about doing it. For example, instead of limiting pursuits to the most aggravated circumstances, cops can now chase if they have a “reasonable suspicion that a person committed, is committing or is likely to commit a felony or violent misdemeanor” (emphasis added).
Your writer is for immediately de-commissioning de-prosecution (so long, Mr. Krasner!). It’s a lousy concept, and has probably led cops to pull back as well. After all, if a D.A. won’t follow through, why bother? As a former law enforcement practitioner he also supports focused policing; i.e., the “hot-spots” approach. Still, as our posts often point out, cops are human. And when some badge-wearers encounter uncompliant citizens, they seem unable to set aside their inner monsters. So before returning to a more aggressive posture, we’d prefer a pause. Let’s make a concerted effort to refine mechanisms, including selection, training and supervision, that can help officers take on – and maintain – the perspective of a skilled craftsperson at every encounter. Then, and only then, crank it back up.
Deal?
UPDATES (scroll)
11/7/24 Elected officials in the “Bluest” of areas may have met their match. Progressive
Los Angeles D.A. George Gascon, who was blasted by his staff for going easy on the accused and hard on cops, was ousted by former Federal
prosecutor Nathan Hochman, who blamed his rival for the waves of theft and misbehavior that haunt L.A. And in California’s violence- and
homelessness-beset Bay Area, voters booted two other progressives: Oakland Mayor Sheng Thao and Alameda County D.A. Pamela Price. Their
preference for pulling back the throttle on policing and punishment seems no longer in favor.
10/28/24 Do “pro-reform” prosecutors increase crime? According to the notably progressive Brennan Center, homicide, aggravated assault and larceny trends during 2018-2024 for cities with “progressive” prosecutors (L.A.’s George Gascon drew special mention) were much the same as those of their peers. But a look at the larceny graph seems to show that during Gascon's term L.A.’s rates have been comparatively higher. Changes in crime rates within cities is not addressed.
10/17/24 In a case brought by four weary San Francisco residents, a Federal judge ruled that they can indeed sue the city for “actively contributing” to problems in the beset Tenderloin area by, among other things, distributing supplies that ostensibly help street people “safely” use drugs. Thus, encouraging their presence. And in nearby Oakland, crime and homelessness have led to a forthcoming recall vote of the Mayor and D.A., whose go-easy law-enforcement approach has supposedly encouraged misbehavior.
9/3/24 Elected in 2020 on a platform of correcting “the sins of the past,” Jason Williams, New Orleans’ progressive D.A., has had “more than 140” convictions thrown out and obtained sentence reductions for “at least 180” accused. His civil rights division focuses on past convictions that were supposedly marred by constitutional issues or unjust legal practices. But an advocacy group, “Bayou Mama Bears”, warns that his actions have endangered public safety and benefited violent criminals.
8/23/24 At a recent news conference, Philadelphia D.A. Larry Krasner announced the conviction
of an offender “who just can’t stop robbing people – he just can’t stop robbing them with guns.” To address that
problem, he has assembled a special team of prosecutors to prosecute violent, armed repeat offenders. Launched in mid-April, the Prolific Gun Offenders Unit will keep an
eye out for “straw buyers” - those who buy guns for felons - and purveyors of ghost guns. Magistrates will also be pressed to set substantial amounts of cash bail before potentially dangerous characters are released.
4/29/24 Inspired by the George Floyd protests, in 2020 progressively-minded Chicago D.A. Kim Foxx announced a policy to not prosecute protesters for disorderly conduct or trespassing as long as they remained peaceful and non-violent. But last November she made clear that this policy will not be in effect during the Democratic National Convention, set for August. The Chicago Tribune’s editorial board recently questioned whether such decisions should be made public. Still, they agreed with the flip-flop.
|
Did you enjoy this post? Be sure to explore the homepage and topical index!
Home Top Permalink Print/Save Feedback
RELATED POSTS
Special topics: Neighborhoods Bail & Sentence Reform Craft of Policing
Want Brotherly Love? Don’t Be Poor! Switching Sides America’s Violence-Beset Capital City
See No Evil, Hear No Evil, Speak No Evil Full Stop Ahead Cause and Effect Hot Spots
Posted 1/20/24
AMERICA’S VIOLENCE-BESET CAPITAL CITY
Washington, D.C. is plagued by, among other things, murder.
Has the President noticed?
For Police Issues by Julius (Jay) Wachtel. “We need the National Guard in D.C.” Recently delivered to reporters for the Washington Post, Councilmember Trayon White Sr.’s sobering call to arms aptly conveyed how citizens and officials feel about the Capital District’s unending struggle against crime and violence
Just how bad are things? Using numbers from the Census, the FBI’s Crime Data Explorer and agency websites, here’s where D.C.’s 2010-2023 homicide rates per 100,000 population sit on Police Issues’ list of “usual suspects”:
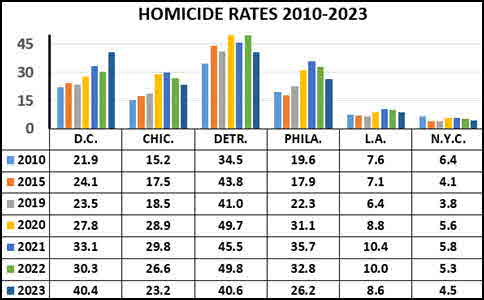
Between 2010-2021, D.C. and each of its companions except the Big Apple experienced steady upticks in homicide. But things turned around in 2022 when all but chronically crime-ridden Detroit enjoyed a decline. That so-called “great crime drop” continued in 2023. This time it included Detroit, where the murder rate fell 18.5 percent. But our nation’s capital was sadly left out. During 2023 D.C.’s murder rate increased by an astounding one-third, winding up only two-tenths of a point short of Detroit’s. According to the Post, “the District was deadlier than 55 of the country’s 60 most populous cities, behind only New Orleans, Cleveland, Baltimore and Memphis.”
Click here for the complete collection of crime & punishment essays
Alas, the Post didn’t publish its data. Usual suspects aside, where does the District sit, crime-wise, among the nation’s major cities? With many agencies, including our hometown LAPD, still not fully aboard the NIBRS, we turned to the Major City Chiefs Association (MCCA). According to its most recent tally, which reports violent crimes from January thru September 2022 and 2023, the news for D.C. really is all bad. Using population figures, we calculated homicide and robbery rate per 100,000 residents and the percent change between 2022-2023 for the MCCA’s fifty-eight member cities. Again, note that these are nine-month rates. Here are comparos between Jan-Sept. 2022 and Jan-Sept. 2023 for the ten cities at each extreme of the murder and robbery spectrums:
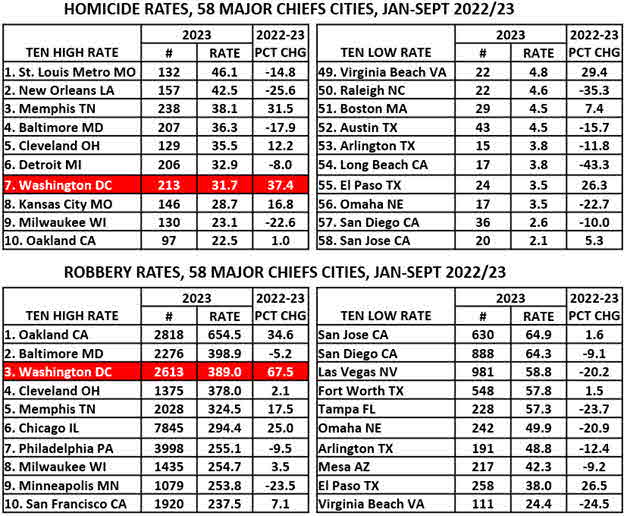
As of September 30, 2023, Washington D.C. was “only” seventh worst murder-wise. Note that its rate increased thirty-seven percent in 2023, the most recorded by any of its counterparts. Ditto its astounding 67.5 percent leap in robbery, which helped it land in third place, robbery-wise. (We left out aggravated assault. Our review of pre- and post-2019 NIBRS numbers suggested that some agencies have been defining it differently.)
Police Issues is far less concerned with aggregate crime rates than with what’s happening in the neighborhoods where people actually live. As our Neighborhoods essays frequently point out – most recently, in “See No Evil – Hear no Evil – Speak no Evil” – economically-challenged places have always absorbed most of the brunt. D.C. councilmember White had plentiful reason to speak out. D.C. has eight Wards, and his – the Eighth – happens to carry the distinction of being the most dangerous.
Just how dangerous?
We downloaded 2023 crime data from Open Data DC. Our graph and table on the left report full-year rates/100,000 pop. for Homicide, Robbery and Aggravated Assault. And the graph on the right displays 2022 poverty percentages for each of the District’s eight Wards:
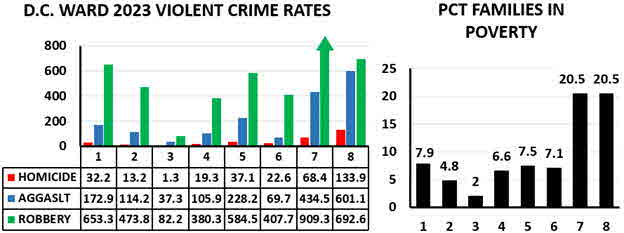
Sure enough, the Eighth can’t be beat. Its homicide rate is twice that of its closest competitor, the Seventh. By a comfortable margin, the Eighth is also worst in aggravated assaults and comes in second to the Seventh in robbery. Now check out poverty. The violence-ridden Seventh and Eighth Wards also happen to be (by far) the poorest, while the crime-free Third Ward is (surprise!) the most affluent. These graphs depict poverty's unholy influence on violent crime:
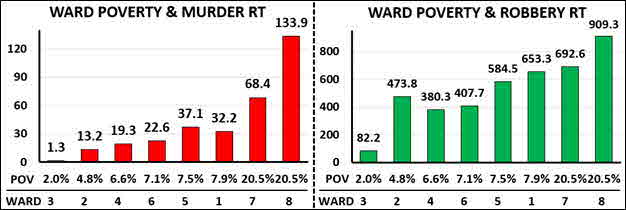
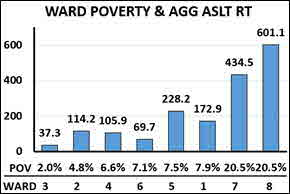
And just like in our previous forays (see, most recently, “Good News/Bad News”), the relationship between poverty and the serious property crime of burglary is far less pronounced:
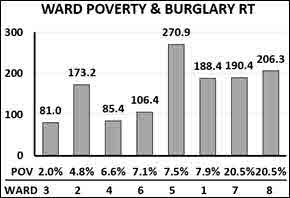
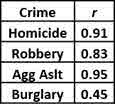 The r coefficient is used to depict the strength of relationships (r’s range from zero, or none, to 1, or a perfect, lock-step association). All the r’s are “positive” (+), meaning that crime rates and percent in poverty increase and decrease together. But while poverty and violent crimes seem very closely associated, the relationship between poverty and burglary is only moderate. The r coefficient is used to depict the strength of relationships (r’s range from zero, or none, to 1, or a perfect, lock-step association). All the r’s are “positive” (+), meaning that crime rates and percent in poverty increase and decrease together. But while poverty and violent crimes seem very closely associated, the relationship between poverty and burglary is only moderate.
None of this should come as a surprise to the District’s political establishment and its hard-pressed residents. While the national media gloats about the supposedly steep decline in America’s crime rates (check out, say, NBC and ABC), the Washington Post keeps running stories about the District’s problems with violence. And yes, they have suggestions. A few days ago its editorial board penned “A Crime-free D.C. Starts With Drug-free Zones.” It favors having police (once again) designate “crime hot-spots” where drug possession and use are forbidden. And keeping persons accused of violent crimes in jail from arrest through trial. And broadening the definition of “carjacking.” And having all cases involving “organized retail theft” classified as felonies. And even getting cops to enforce the civil laws against fare evasion.
Indeed, these provisions (and more) were part of “Addressing Crime Trends Now Act (ACT Now)”, a D.C. bill that Mayor Muriel Bowser introduced last October. Touted as “New Legislation to Support Safe and Effective Policing”, it would supposedly enhance “accountability for those who choose to commit crimes and inflict fear in our neighborhoods.” Long-standing legal constraints that have “made it more difficult for police to keep the community safe and hold criminals accountable for their actions” would also be relaxed:
The new legislation clarifies the distinction between a serious use of force and incidental contact with the neck, ensures officers can review their body-worn camera footage prior to writing their initial police report in certain circumstances, makes permanent clarification of vehicular pursuit, and defines what information will be posted publicly related to officer discipline and more.
George Floyd forever altered the socio-political landscape in which cops work. One consequence was that police agencies across the U.S. abandoned long-standing practices such as stop-and-frisk. To be sure, after considerable fiddling, some cautiously returned them to the shelf. And as one would expect, there’s been blowback. Only two weeks before the Post’s editors championed “drug-free zones” its lowly reporters authored a story that concluded the Mayor and D.C. Council had “turned away from progressive strategies meant to ease the footprint of law enforcement in the community”. Hot-spots was back! (Officials, though, insist that its new, improved incarnation incorporates the very best aspects of “community policing”.)
It’s not that we oppose being pro-active. After all, hot-spots does carry NIJ’s seal of approval. But several weeks ago, as we looked for something to write about, our attention fell on a Post reader’s skeptical reaction to the rebirth of “crime-free drug zones”:
I don’t think incarceration is going to do much but just fill prisons. But I don’t think excusing it and never calling out family structure break-down, kids with no boundary setting parents, etc, is the answer either. Because it’s my neighbors and my neighborhood and my community that winds up carrying the brunt of all of this weaponized empathy
Be sure to check out our homepage and sign up for our newsletter
Bingo! Let’s get back to the basics. Really, no matter how well policing is done, it’s not the ultimate solution. As we often do, let’s self-plagiarize from “Fix Those Neighborhoods!”:
Preventing violence is a task for society. As we’ve repeatedly pitched, a concerted effort to provide poverty-stricken individuals and families with child care, tutoring, educational opportunities, language skills, job training, summer jobs, apprenticeships, health services and – yes – adequate housing could yield vast benefits.
To be sure, the District would need a considerable chunk of change to give its needy neighborhoods a chance to prosper. Yet D.C. is America’s capital. It should exemplify our nation’s very best. Not, as things stand, its very worst. (Well, almost very worst. Thanks, Detroit!). Perhaps Silly Circus (that’s what your author and his Federal colleagues called the Secret Service) could apprise the Chief of what’s happening all around him, twenty-four/seven. He obviously doesn’t know.
UPDATES (scroll)
6/16/25 Truancy besets D.C.’s school system. One-third of its K-12 students - 16,000 - missed at least two weeks during the 2024 school year. Truancy has markedly increased during the last decade. It’s far worse in D.C.’s economically-deprived areas, where youth crime is also off the charts. An in-depth piece in the Washington Post blames schools and public officials for failing to implement (or properly implement) special programs that provide floundering students with academic supports. And for not acting when the programs that are in place don’t work out. But many readers point to lousy parenting and a poor home environment as the underlying causes, and truancy and crime as their effects.
5/30/25 Seven fatal shootings in the past five days brings D.C.’s murder toll to 68 this year, one less than at this point in 2024. And just before this gruesome string began, nine persons had been fatally shot in nine days. “We are seeing far too many interpersonal conflicts being settled with guns” says D.C. police chief Pamela Smith. Among these sixteen murders was the killing of two employees of the Israeli embassy. Its perpetrator, Elias Rodriguez, shouted “Free Palestine” as police led him away.
5/20/25 Lethal gunplay continues to beset the nation’s Capital. Five D.C.-area residents - three in their thirties, one in his twenties, and a 17-year old - were gunned down in the six-day period ending Sunday, May 18. While robberies and nonfatal shootings are down 22 percent, the District has suffered 57 murders this year, only a sliver less than the 61 reported at this point in 2024. So is violence really down? That’s reportedly become a bone of contention between the city and its newly-installed Federal overseers, who seem skeptical about the “improvement.”
3/5/25 Darrell Moore, now 47, was released from prison in 2020 for a murder that another person committed while he participated in a robbery crew when he was sixteen. Moore didn’t have a gun then but aggressively wielded a knife. He drew 66 years but thanks to D.C.’s 2016 Incarceration Reduction Amendment Act only served twenty-six. And he’s again been convicted of murder, for a killing he committed six months after his release.
Vowing to “make D.C. safe again,” Ed Martin, President Trump’s interim U.S. Attorney, announced he would prosecute gun-toting felons in U.S. District Court on Federal charges instead of letting them be dealt with in Superior Court. A dozen extra ATF agents are enroute to help out. His strategy is a re-do of the approach taken during President Trump’s first term. USA Martin castigated the Capitol riot cases as distractions from the fight against violence and recently demoted seven lawyers who worked on those cases. But two, according to the Post, also specialized in gun cases.
1/29/25 A 14-year-old D.C. youth “with a big smile” was shot dead by another 14-year old during a robbery spree by the killer and his two 16-year old brothers. Video surveillance depicts the shooting. It also shows the three robbers holding up other victims, then fleeing in a White Kia sedan. Their arsenal included a .40-caliber pistol, a 9mm. pistol, and “a Kalashnikov rifle in a duffel bag.”
11/21/24 “We were bored. We were looking for someone to beat up.” That’s how a D.C. girl explained why she and four girlfriends - each was then 13-14 years old - beat and stomped to death an elderly, disabled man out for his usual stroll. A judge just convicted two of the girls of second-degree murder, and they face a maximum sentence of detention until the age of twenty-one. The other three admitted their roles and pled to lesser charges; one, who said she “went along” with her friends, got three years.
10/14/24 And the carnage in D.C. continues. Last week our nation’s capital suffered five dead in five shootings over four days. Two persons were also wounded in the gunfire, which reportedly took place in five different neighborhoods. D.C. also had three homicides from a fire, and one by a stabbing. Nine murders in four days. And that’s how the story in the Washington Post ends.
7/15/24 After a four-month trial that featured video surveillance, text messages and testimony from more than one-hundred witnesses, a D.C. jury convicted Tyiion Freeman, 24, Koran Jackson, 23, and Stephen Nelson, 33, of murder, conspiracy and weapons violations. In 2020, their two-week “turf war”, waged in retaliation for the 2019 killing of an associate, wounded ten persons and killed Malachi Lukes, an innocent thirteen-year old who was walking by with his friends. Two other accused are pending trial.
6/17/24 D.C. has been installing speeding and stop-sign cameras since 2015, when its “Vision Zero” traffic safety project launched. And wherever they’re placed, they seem to working, with tickets plunging in one block from 7,556 citations in February 2022 to 316 in November 2023. But despite the nearly 500 cameras now in place, fatal crashes reached a peak of 52 last year. Serious injuries have also gone up, increasing 15 percent since 2015. And as a 2022 news story reported, accidents and reckless driving particularly afflict low-income neighborhoods.
5/24/24 D.C.’s violent crime problem has led to a “surge” of Federal law enforcement attention. DEA agents are targeting the traffickers that supply and the heavily armed gangs that establish and defend open-air drug markets which supply fentanyl, crack cocaine and heroin to all comers. Dozens of violent crimes and numerous “bursts of gunfire” in a chronically beset neighborhood just led to the arrest of nine members of a drug trafficking crew who were dealing in drugs that originated in Trinidad. This case led to the execution of fourteen search warrants which yielded large sums of cash and numerous weapons.
5/7/24 Gun violence continues to beset D.C. On Friday, May 3rd. one of the many bullets fired during an exchange of gunfire between a vehicle and persons on the street flew into a classroom at Dunbar High School. A 17-year old student was grazed in the head and wound up in the hospital. Two teens, one 17, the other 18, were arrested. Later that day, Ty’ah Settles was shot and killed when the SUV in which she was riding unexpectedly wound up in the middle of “a gun battle” near her home. Ty’ah was three.
4/22/24 Hundreds of young persons had gathered for a “senior skip day” at a county park 15 miles NE of Washinton D.C. when gunfire rang out. Five teens, ages 16 to 18, were wounded, one critically. The shooter, also young, fled. While overall crime in Prince George’s County is down, violent crime is up 9 percent, and youth violence has become chronic. Ninety-two juveniles were arrested on gun charges in 2023. This shooting came only two hours after a shooting in D.C. wounded three men and a 16-year old.
4/15/24 Despite a reported citywide easing in violence, residents of D.C.’s beset “Carver-Langston” area, in the Fifth Ward, continue to suffer. During the late afternoon hours of April 10, two persons exited a car with tinted windows and fired “dozens of rounds” as pedestrians, including children, strolled by. A 29-year old man was killed and five persons, including a 9-year old and his 12-year old friend, were wounded. Their mothers said they plan to leave the area. The shooters managed to evade police.
3/26/24 It’s not just D.C. Its “closest suburbs” are reeling from years-long increases in violent and property crime. Carjackings are rampant. Prince George’s County had 86 in 2019 and a stunning 508 in 2023. Montgomery County had 19 in 2019 and 99 last year. A resident complained that “criminals are more brazen today.” Thieves recently tried to take the wheels off his son’s car. And security cameras didn’t keep his neighbor’s home from being burgled. But 2024 has brought some improvements, and officials are hopeful that the downward trend in crime will continue.
3/25/24 D.C.’s “drug-free” zones, which empower police to expel suspected drug users and sellers, are now in effect at three locations. By law they can last only five days. But it’s hoped that this provision of the District’s new “Secure D.C.” bill can help tackle the street crime problem. Many residents welcome the intrusion. But some worry of police overreach. And there’s also a concern that the zones will take the place of drug and mental health treatment.
3/20/24 Attorney General Merrick B. Garland announced a substantial drop in crime between 2022-2023, including “an over 13% decline in homicides.” According to the Major City Police Chiefs Association, its 69 member cities reported slight to moderate decreases in violent crime. Our tabulation of its data shows a 10.4% decrease in homicides. Rapes declined by 8.3%, aggravated assaults fell 2.7%, and there were 0.8% fewer robberies. But some cities bucked the trend. For example, homicides increased 9% in Dallas, 22.6% in Seattle, and 35% in D.C.
3/13/24 D.C. Mayor Muriel Bowser signed “Secure D.C.,” a comprehensive anti-crime measure that was prompted by her city’s problems with violent crime. Among (many) other things, it increases penalties for certain gun offenses and lesser thefts, broadens the definition of “carjacking,” relaxes restrictions on police chases and use of force, increases judges’ ability to detain potentially dangerous persons, and allows police to designate “drug-free zones”. Bill text
3/4/24 Both poverty and crime-wise, D.C.’s 6th. Ward is definitely on the privileged end of the scale. But its influential residents have also suffered some nasty encounters, and many “Blues” are upset with their liberal Councilmember’s progressive views about crime. Charles Allen helped slash the police budget, and he wants to reduce mandatory minimum sentences for some violent crimes. So they’ve mounted a recall campaign.
2/22/24 D.C. council-members representing the First and Sixth Wards have been targeted for recall by critics who accuse them of fueling the crime surge. Both, along with the rest of the Council, approved a 2020 budget that redirected police funding to “alternate justice programs.” They also backed a 2022 initiative - again, passed by the full Council - that, among other things, lessened mandatory penalties for violent crimes. But Congress blocked the latter move.
2/15/24 Three D.C. police officers were shot and wounded, none seriously, as they forced their way into a residence to arrest its occupant for animal cruelty. Thirteen hours later, their as-yet unidentified assailant was taken into custody. He had fired on the officers through the door. Two were struck in the lower legs and a third was shot twice in his ballistic vest. He was bruised but the bullets didn't penetrate.
1/31/24 According to a Washington Post columnist, a shortage of judges and an explosion in criminal case filings have caused a “docket jam” in D.C.’s court system. Juvenile crime has also increased and become more violent, and mental commitments and requests for protection orders are way up. Like issues beset domestic relations and probate and tax work. “Benches are empty. White House and Senate, do your part. Do your duty.”
1/29/24
DOJ has pledged a �surge� of Federal resources to fight spiraling violent crime and carjackings in D.C. �Lethal� and �non-lethal� firearms- related cases will also be a priority. Analytical tools are being deployed to help select cases that merit special attention, and Federal prosecutors will be assigned to help handle the increase in workload.
1/22/24 The slaughter on the streets of our nation’s capital continues as a 23-year old Catholic charities volunteer working to help struggling neighborhoods is shot and killed in a street robbery. Meanwhile, as he enjoys activities at a theme park in Florida, a 14-year old resident of D.C. recounts the funeral, a week earlier, for two friends, one 15, the other 17, who fell victim to gunfire. Mentors had brought Rashad Bates to Orlando for a respite.
|
Did you enjoy this post? Be sure to explore the homepage and topical index!
Home Top Permalink Print/Save Feedback
RELATED POSTS
Neighborhoods special topic
Point of View Want Brotherly Love? Don’t Be Poor! De-Prosecution? What’s That?
Shutting the Barn Door See No Evil – Hear no Evil – Speak no Evil Good News/Bad News
Fix Those Neighborhoods!
|